I had a previous entry about the configuration of logstash to capture the diagnostic, out, log, access, and garbage collector logs http://carlgira.blogspot.com/2017/09/logstash-configuration-for-weblogic.html . The idea of this entry is to explain a tool i just build to monitor a weblogic server using a custom beat of ELK (elasticsearh, logstash, kibana)
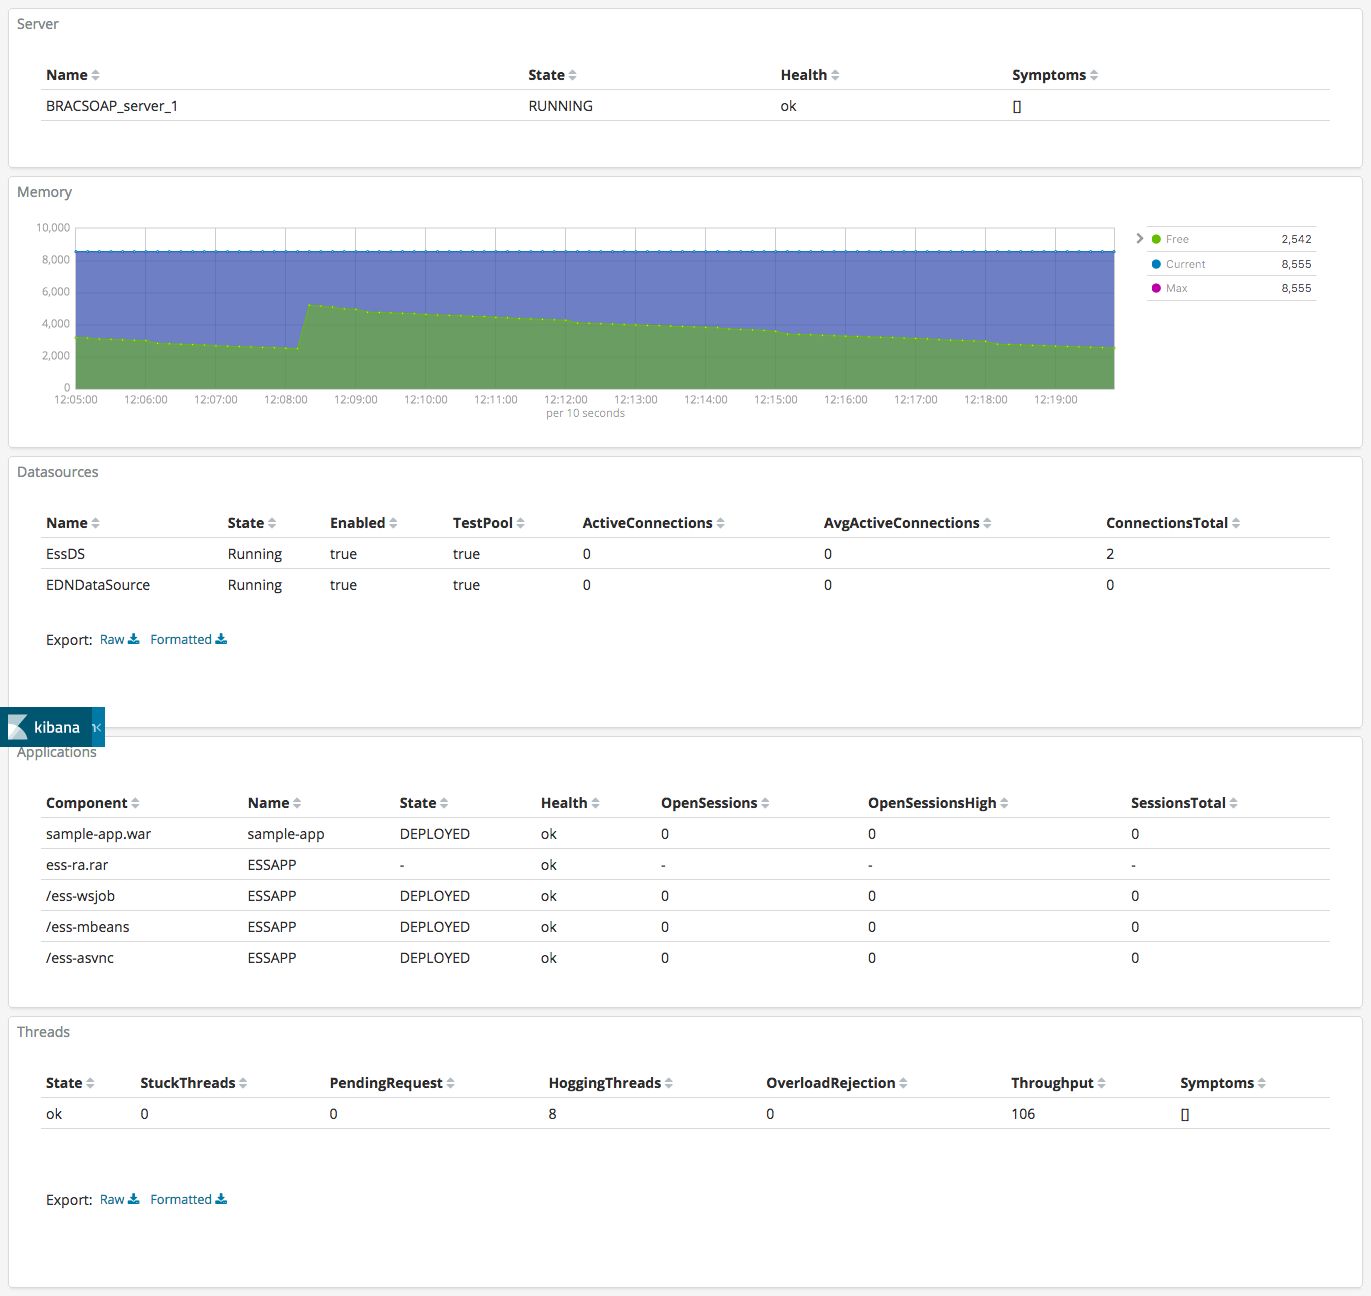
The tool is able to capture information about:
- Server state and health
- Memory use
- Threads status
- Datasource health and statistics
- Applications health and statistics
Configuration
- Download the tool from the releases link https://github.com/carlgira/weblogicbeat/releases
- Edit the file weblogicbeat.yml with your configuration.
weblogicbeat:
  period: 60s
  host: http://localhost:7001
  username: weblogic
  password: welcome1
  servername: server1
  datasources: ["EssDS", "EDNDataSource"]
  applications: ["ESSAPP", "sample-app"]
- period: How often an event is sent to the output
- host: Admin host and port
- username: Weblogic admin user
- password: Weblogic admin password
- servernam: Name of the server to monitor
- datasources: Array of datasources to monitor
- applications: Array of applications to monitor
- Run the tool
./weblogicbeat
Kibana
After starting weblogicbeat all the information should be arriving to kibana (remember to create an index with the name "weblogicbeat*") I create a set of visualizations and one dashboard to show all the metrics about weblogic.
You can download the file https://github.com/carlgira/weblogicbeat/blob/master/kibana-weblogic-dashboard-export.json and import it to kibana. (follow instructions here https://www.elastic.co/guide/en/kibana/current/managing-saved-objects.html
Compilation
If you prefer to compile your own version you can go to the github repo and follow the README instructions. (or change it as you want). https://github.com/carlgira/weblogicbeat
Links of interest
-
Using WebLogic 12C RESTful management for monitoring WebLogic Domains
https://blog.dbi-services.com/using-weblogic-12c-restful-management-for-monitoring-weblogic-domains/
-
Monitoring Domain Resources
https://docs.oracle.com/middleware/1221/wls/WLRUR/examples.htm#WLRUR203
-
Weblogic monitoring exporter
https://github.com/oracle/weblogic-monitoring-exporter
-
Jolokia
https://jolokia.org/